English
Slowlog Governance
Background
During a production timeout investigation, we found a large number of slow logs already present on the cluster. Slow commands block Redis’s main thread; if occasional timeouts are left unaddressed, they can spread to more applications sharing the instance—so we ran a focused remediation.
Goals
- Cut daily slowlog volume in production by 90%+
- Stop Redis timeouts caused by slow commands
Approach
Closed loop: establish a baseline → classify and locate → schedule fixes → prevent recurrence
1. Baseline before fixes
Redis SLOWLOG is an in-memory ring buffer: it has a size cap, newer entries push out older ones, and a process restart clears it. “Open the client and glance once” cannot support classification, scheduling, or before/after comparison. Set the baseline first:
| Item | What we did | Why |
|---|---|---|
| Threshold | 10ms (Redis default) | Matches the official default; during remediation, fix commands already over 10ms instead of debating the threshold |
| Retain count | Default 128 → 512 | 128 was already full (too small), but the true volume was unknown; we tried 512 empirically, it did not fill up, so we kept it |
| External persistence | Periodically pull all cluster nodes, ingest only yesterday’s records | Safe to re-run the same day; no need for SLOWLOG RESET; without daily history you cannot measure remediation impact |
| Alerting | Daily count of ingested rows (sum across the cluster), notify when over threshold | Depends on daily history, not an in-memory snapshot; threshold is tunable (100 in this program) |
When changing slowlog-max-len, align every node and run CONFIG REWRITE so a restart does not fall back to 128.
2. Two root-cause types when locating
With a baseline in place, use persisted data to rank by command type, key prefix, and so on. Fix the highest-share cases first, and align remediation design and release windows with application owners.
How to attribute sources: A client name is best. Without it, a key prefix usually points to the owning app; confirm with a code search, and check with the owner if unsure. Under containers, the client IP is often the host IP and should not be treated as an app id.
| Type | Typical signs | Principle |
|---|---|---|
| Unsafe command usage | KEYS, DEL on large keys, oversized one-shot HGETALL / HMSET | Switch to safer commands or split batches |
| Design gaps | Must scan the whole keyspace to learn which keys exist; hot large hashes read in full repeatedly | Clarify what the business actually needs, then change structure or add a local cache |
3. Common fix patterns
| Symptom | Direction |
|---|---|
Frequent KEYS + batch reads | If only TopN is needed: precompute into a fixed key; for cleanup: use SCAN |
Frequent HGETALL / wide HMGET | Local cache to cut rate, or HSCAN in batches (tune COUNT by size) |
Large HMSET / HSET | Split into smaller batches |
DEL on large keys | Use UNLINK (key becomes invisible immediately; memory is reclaimed asynchronously) |
Why not ban KEYS immediately
rename-command KEYS "" blocks misuse at the server, but do not cut over production at the start of remediation:
- Leftover callers: Disabling first can cause outages instead of driving fixes.
- Older stacks may lack solid
SCANsupport: Upgrade before migrating cleanup paths. - Order: Fix by share → disable
KEYSin dev/test as a gate → only then consider production once slowlogs (including history) show noKEYSor only acceptable noise.
4. Preventing recurrence
- Alerting: Follow up when the daily slowlog count exceeds the threshold.
- Standards: Ban
KEYS; preferUNLINKfor large keys; do not pull large hashes in one shot; batch large writes. - Environment gates: Disable
KEYSin dev/test first; reassess production after leftover usage is gone.
Results
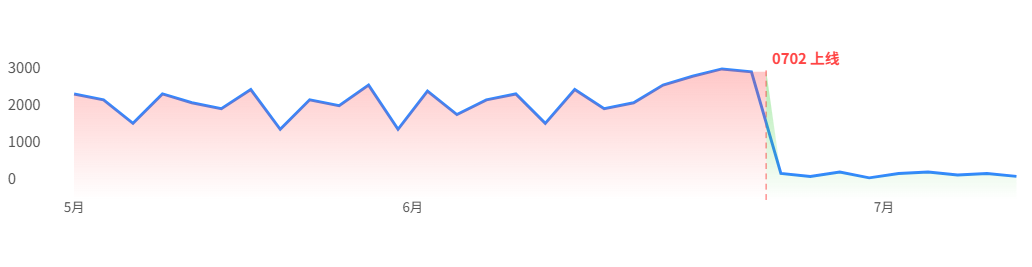
- Daily slowlog count (sum across the cluster, yesterday’s ingest) down about 96% on average
- Key API load tests: ~100× for TopN-style paths; roughly 2× for large-hash read paths
Role of RedisME
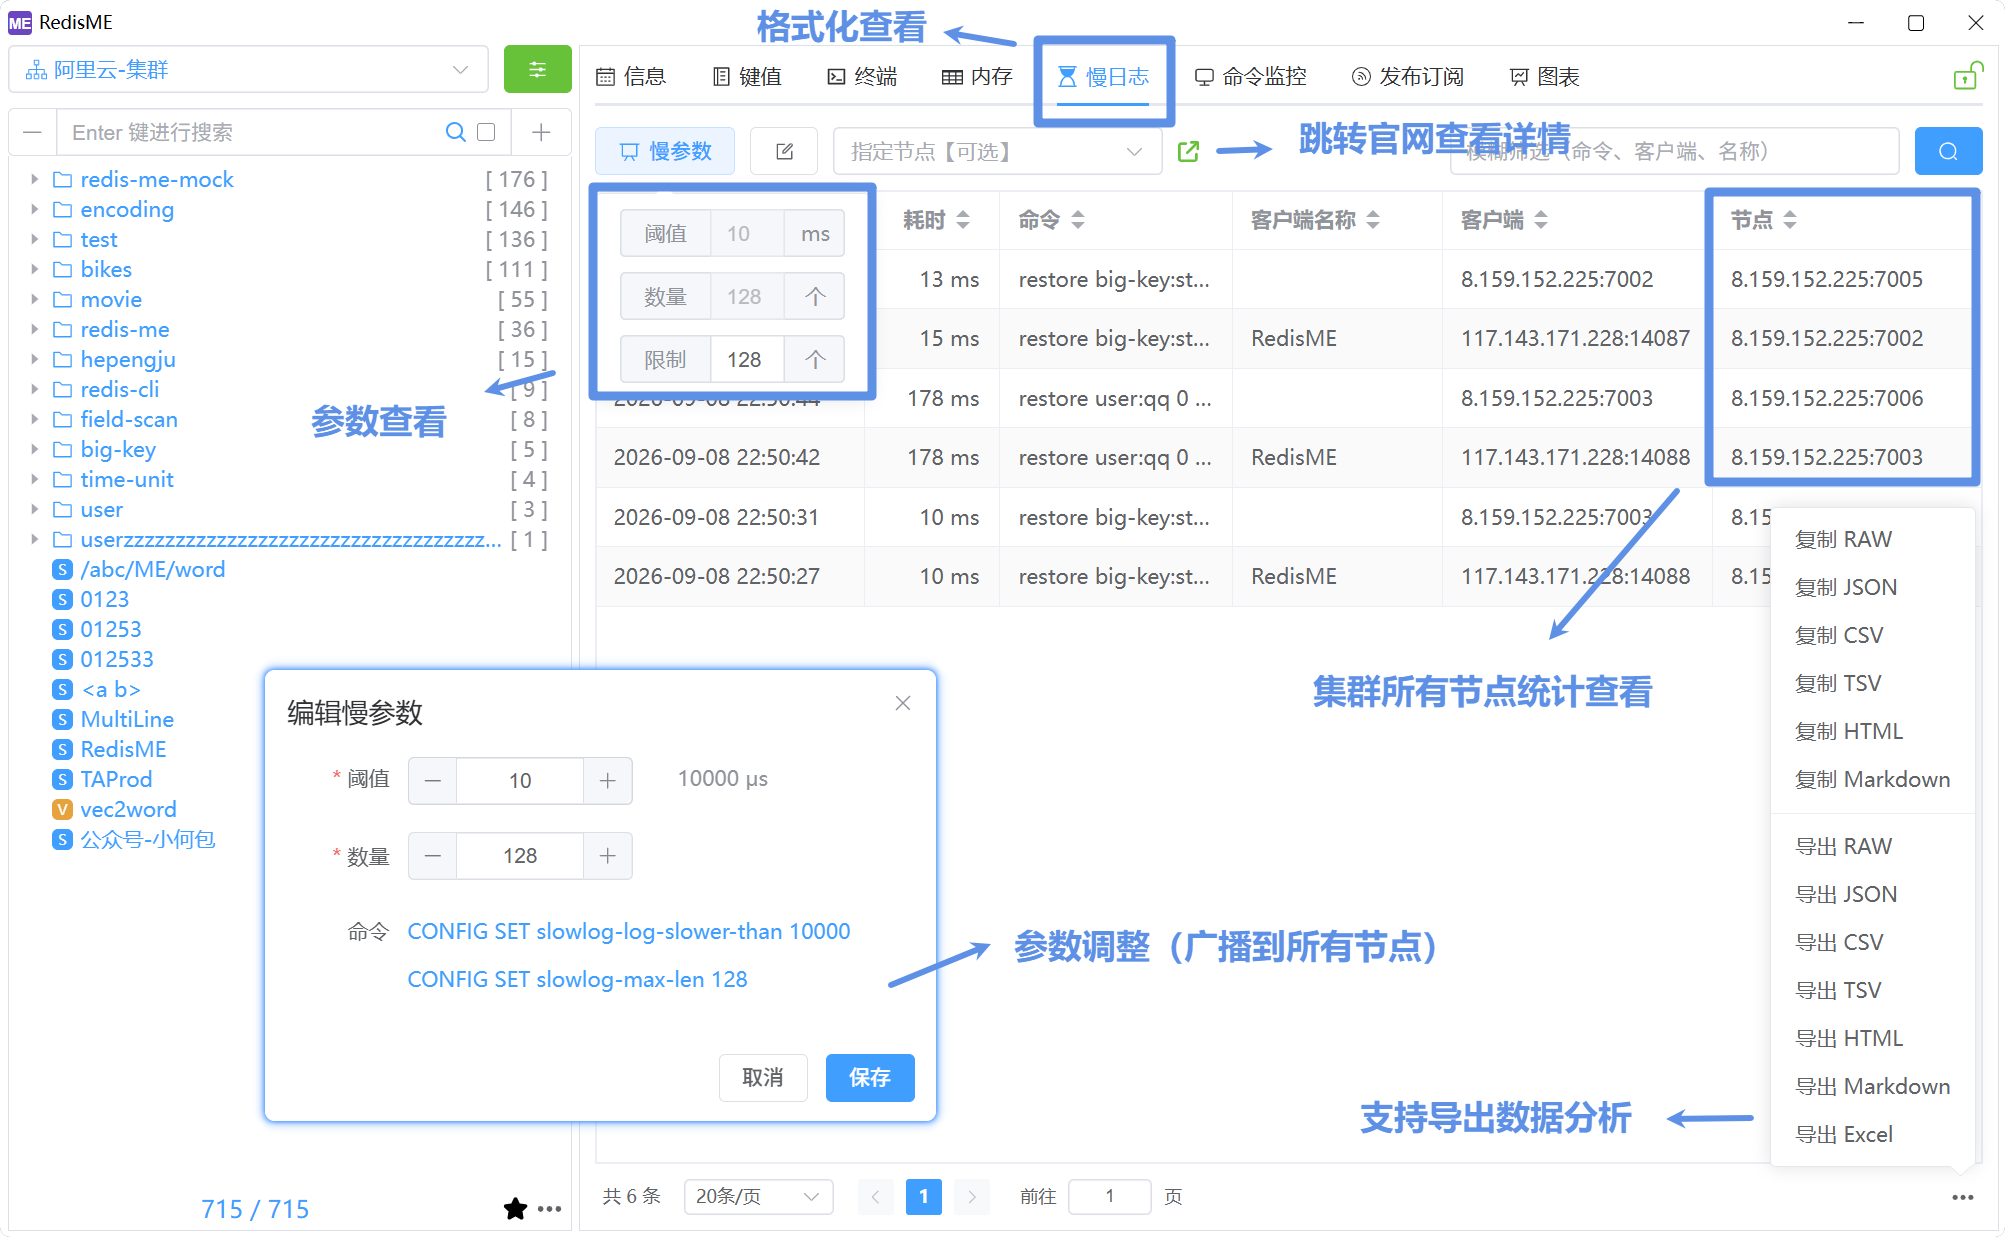
RedisME’s slowlog view, export, and parameter edits are optimized for clusters—inspect and configure across nodes together.
- Formatted view
Table of command, latency, client, time, and so on, with filter/sort—easier to spot hot patterns than rawSLOWLOG GET. - Export
Supports offline classification and owner alignment; also useful as manual sampling before persistence is online. - Slow parameters
Edit threshold andslowlog-max-len(e.g. 128 → 512) in the UI; apply once to all cluster nodes. - Persist parameters
CONFIG SETalone is lost on restart. RunCONFIG REWRITEin the Terminal (broadcast supported) to write the config file.