Chart
RedisME charts are based on the data returned by Redis' info command and are drawn using chart.js. They play an important role in performance stress testing and server monitoring and troubleshooting.
Feature Overview
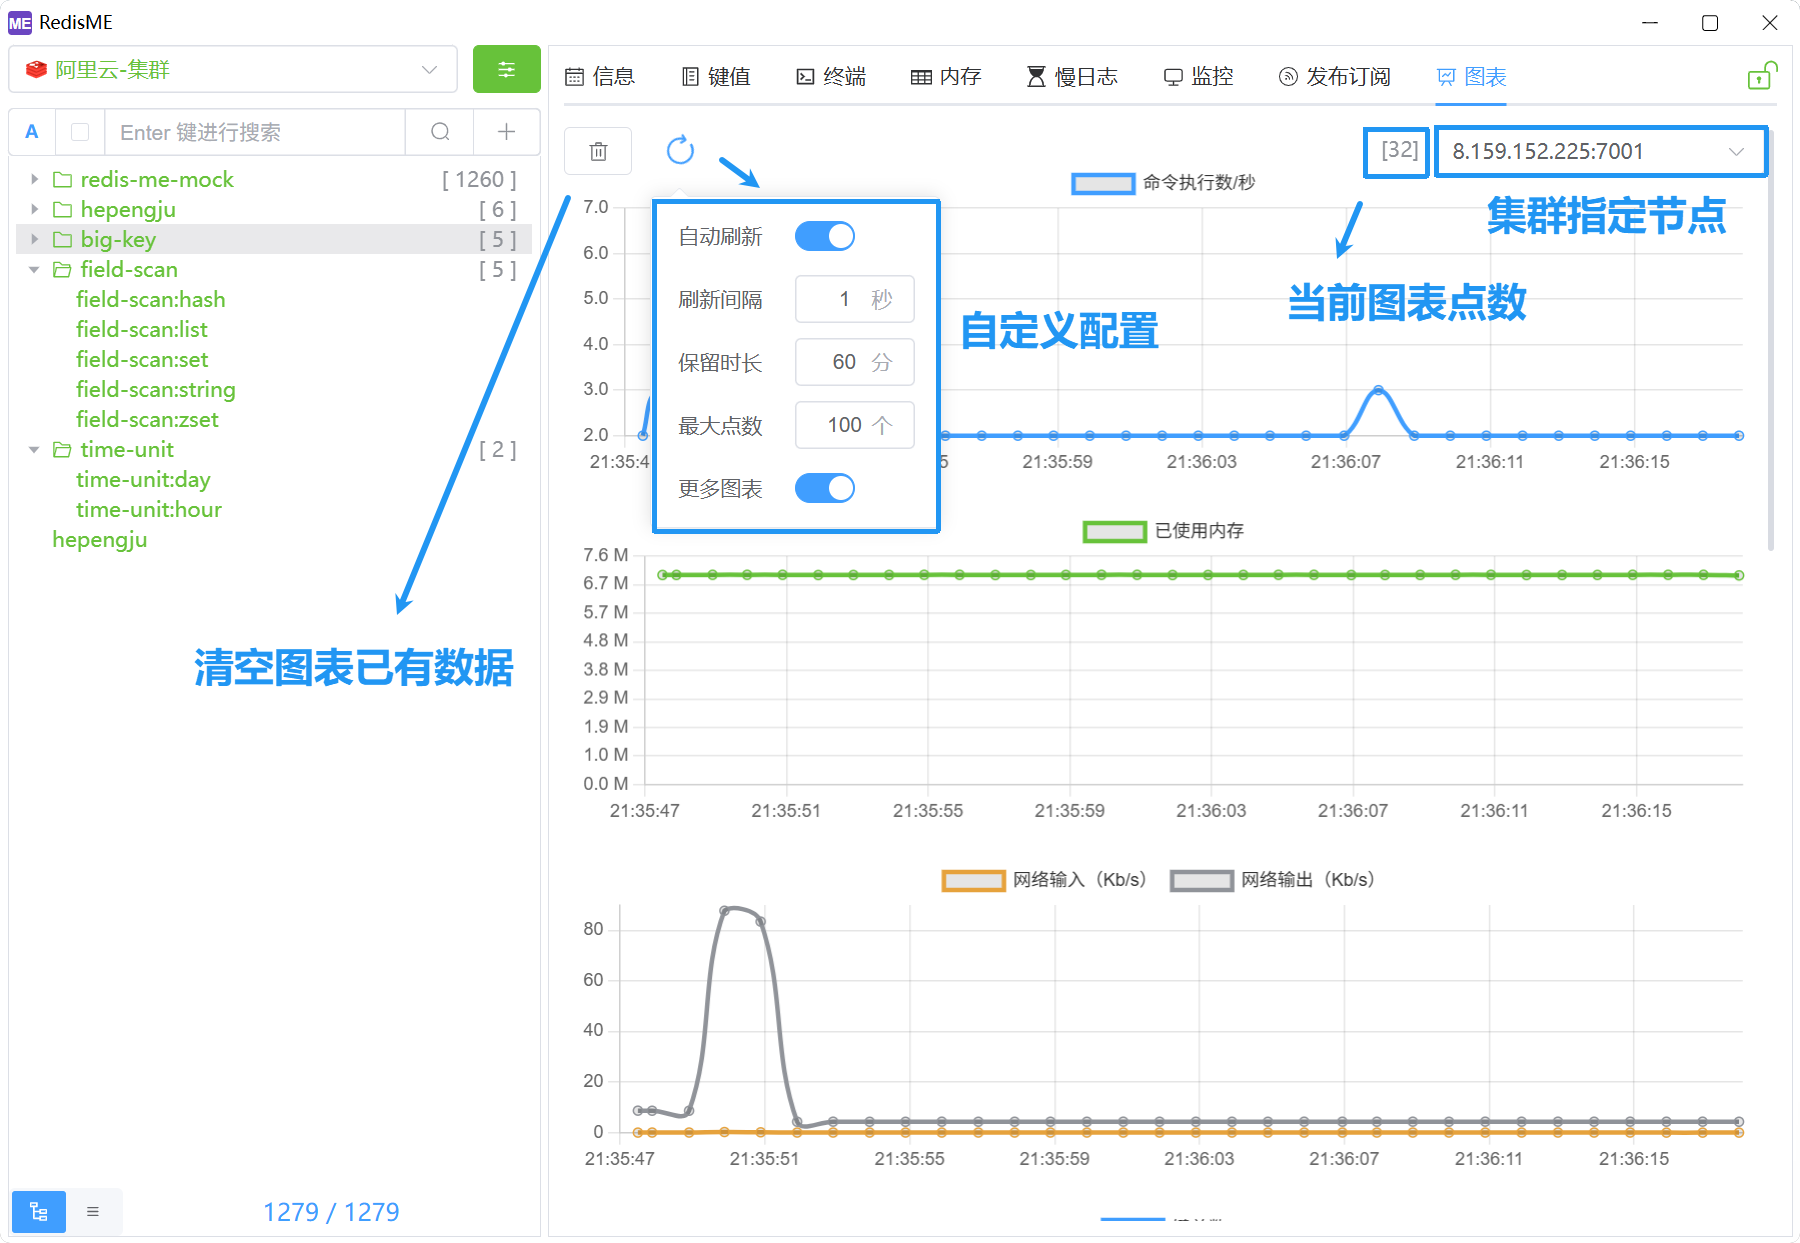
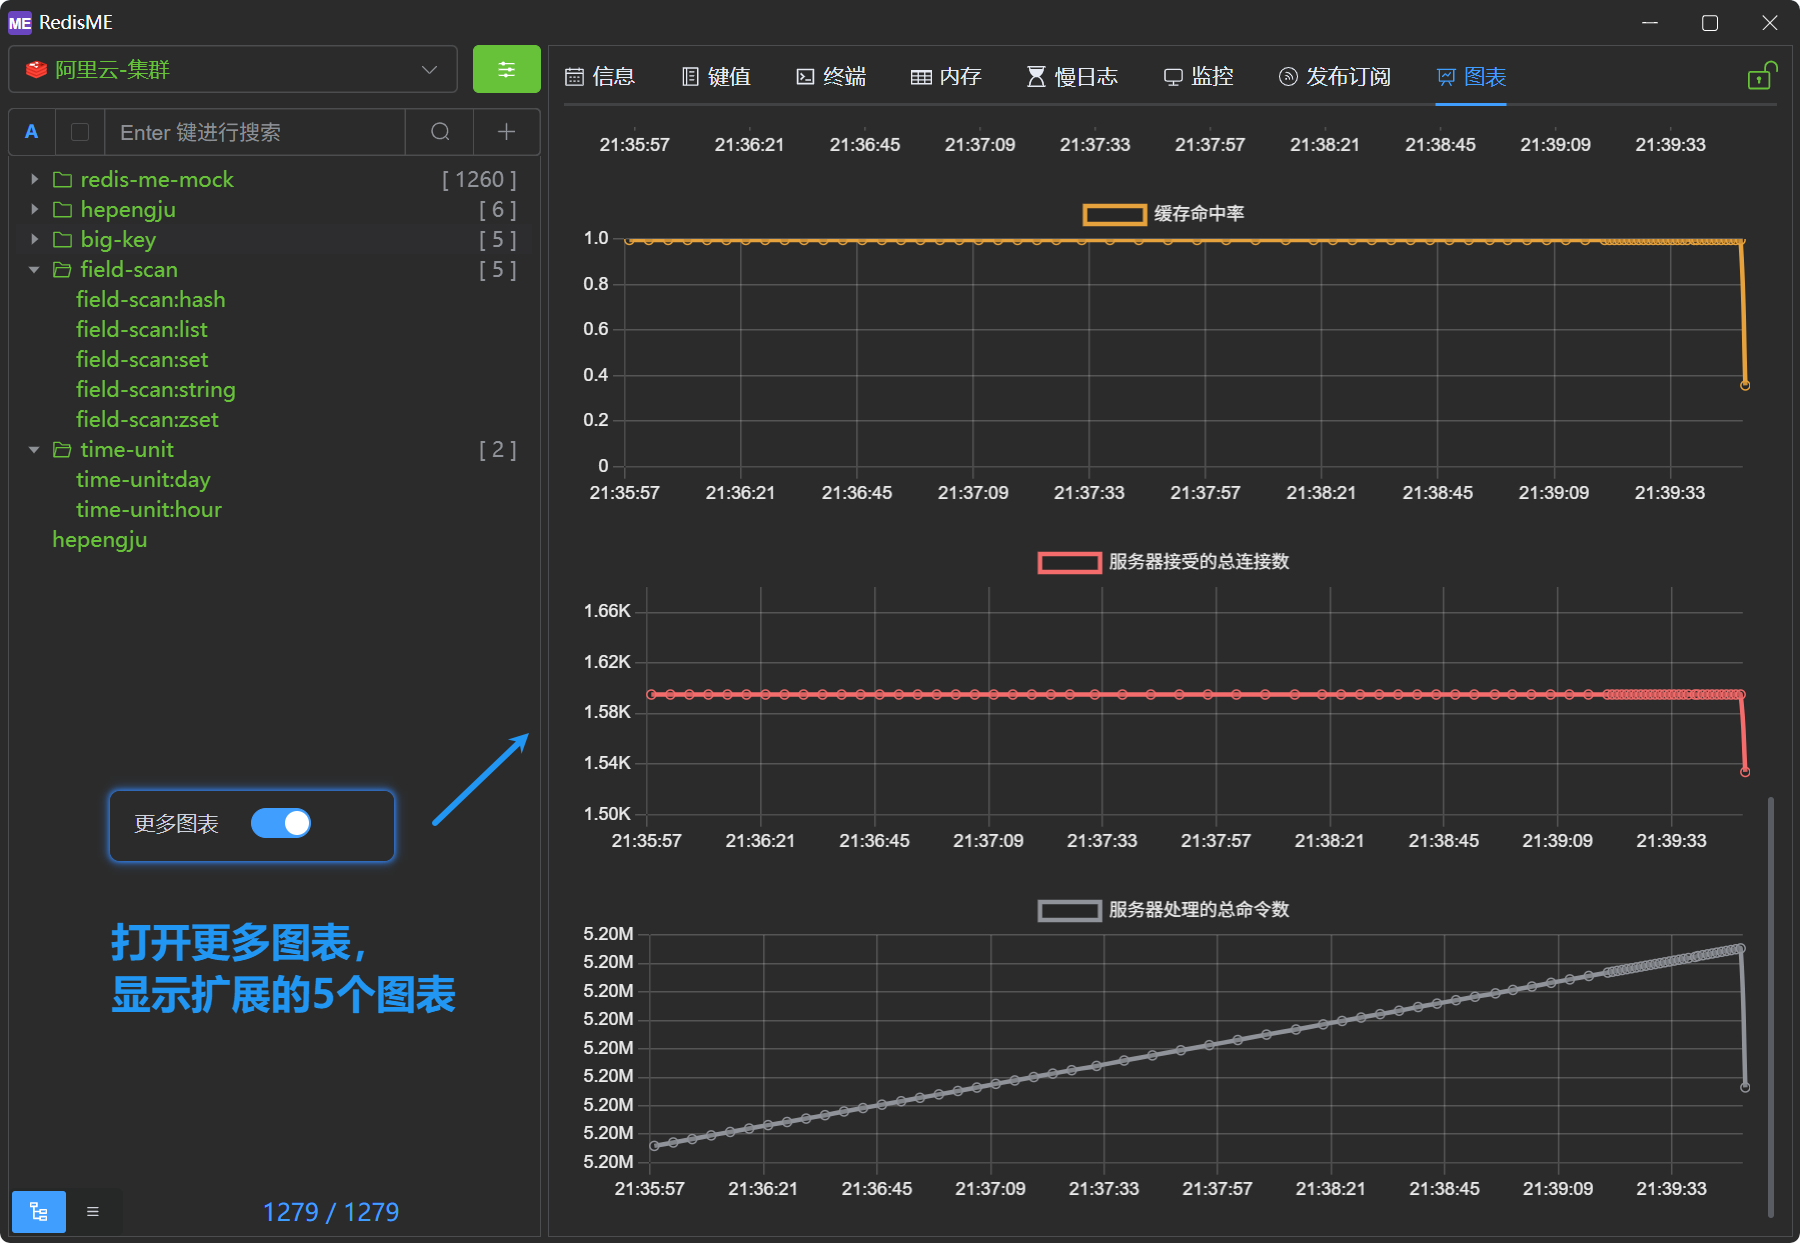
- Rich Data Charts: By default, the first 3 charts are displayed. Click 'More' to show another 5 extended charts.
- Default: Number of command executions per second, used memory, network input and output.
- Extended: Number of keys, number of client connections, cache hit rate, total number of connections and total number of commands received by the server.
- Config Params: Whether to auto - refresh, refresh interval, retention duration, and maximum number of points (using the time - equal - division algorithm).
- Specify Node: In cluster mode, it supports monitoring the data of a specific master node or slave node.

Indicator details
rust
// 图表的计算指标说明
struct RedisChart {
    node: String,

    // db0:keys=1558,expires=0,avg_ttl=0,subexpiry=0; db1:keys=50,expires=0,avg_ttl=0,subexpiry=0
    key_total: u64,                 // 键总数
    connected_clients: u64,         // 客户端数量
    instantaneous_ops_per_sec: f64, // 命令执行数/秒
    used_memory: u64,               // 内存使用量
    instantaneous_input_kbps: f64,  // 网络输入
    instantaneous_output_kbps: f64, // 网络输出

    total_connections_received: u64, // 服务器接受的总连接数
    total_commands_processed: u64,   // 服务器处理的总命令数

    // 计算缓存命中率: Cache Hit Ratio = keyspace_hits / (keyspace_hits + keyspace_misses)
    keyspace_hits: u64,   // 在主字典中成功查找键的数量
    keyspace_misses: u64, // 在主字典中查找键失败的数量
    cache_hit_ratio: f64, // 缓存命中率
}